
주식에 관심이 많은 사람들과 대화하는 것은 언제나 즐겁다. 나에게 주식투자는 단순한 돈의 문제가 아니라, 산업을 공부하고 회사를 깊이 있게 들여다볼 수 있는 통로이기 때문이다. 그래서 비슷한 섹터를 공부해 본 사람들과 관점을 나누고, 그들의 생각을 듣는 것은 언제나 자극이 된다. 누군가와의 생산적인 대화는 좋은 책 한 권을 만난 것처럼, 배움의 기쁨을 준다.
가끔 친구들이 내게 묻는다. “너는 주식투자를 어떻게 해?” 나는 그 질문에 딱 떨어지는 방식이나 종목을 얘기하진 않는다. 오히려 어떤 근거로 투자 결정을 했는지, 그 종목을 고르게 된 맥락이 무엇이었는지, 산업에 대한 나의 Outlook이 어떤지를 중심으로 이야기하게 된다. 결과보다는 판단에 이르기까지의 생각을 나누는 것이 훨씬 가치 있다고 생각하기 때문이다.
나는 투자에 “정답”은 없다고 본다. 수익률보다 더 중요한 건, 내가 어떻게 그 판단에 도달했는 가다. 그것은 단순한 정보의 나열이 아니라, 스스로의 분석을 얼마나 신뢰하는지, 그 판단을 끝까지 밀어붙일 수 있는 확신이 있었는지에 대한 훈련이기도 하다.
이 글에서는 지금까지 내가 투자에 대해 공부해 오며 정립해 온 스크리닝 기준에 대해서 정리해보려 한다. 내가 학생이 된다면 가장 먼저 해보고 싶은 일이 투자와 관련된 책을 모두 읽는 것이라고 말할 만큼, 나는 여전히 이 세계를 탐구하는 중이다. 그리고 이 글은, 그 여정의 중간에서 남기는 나만의 메모이기도 하다.
1. 어떤 방식으로 기업을 발굴하는가?
나는 노가다를 잘한다. 아니, 정확히 말하자면 단순하고 반복적인 작업을 귀찮아하지 않는다. 대부분의 사람들에게는 지루하고 비효율적으로 보일 수 있는 이 과정이, 나에게는 투자에서 가장 가치 있는 일이라고 믿는다. 시장의 기회는 결국, 많은 사람들이 귀찮아서 하지 않는 그 한 걸음 더에서 발견된다고 생각하기 때문이다.
기업을 발굴할 때 나는 말 그대로 노가다에 가까운 방식으로 접근한다. 나는 주로 미국과 일본 시장에 상장된 기업들을 투자 대상으로 삼는다. 미국에는 다양한 거래소를 합쳐 약 1만 개 가까운 종목이 존재하고, 일본에는 4천 개를 조금 넘는 종목이 상장되어 있다. 이 수많은 기업들 중에서 기회를 찾기 위해, 나는 전수조사에 가까운 스크리닝을 매 분기마다 반복한다.
매 분기 실적 시즌이 지나면, 기업별 실적과 시가총액, PER, 매출, 영업이익, 순이익, 자산, 부채 등 가장 기본적인 재무지표들을 엑셀 시트에 정리한다. 단지 숫자를 나열하는 것이 아니라, 이 숫자들이 가진 의미를 파악하고, 기업 간의 차이를 비교하며, 이 안에서 가능성이 있는 종목을 한 칸씩 좁혀가는 작업이다.
나는 이 과정이, 투자의 절반 이상을 결정짓는 일이라고 믿는다. 좋은 기업을 찾는 것이 아니라, 나쁜 기업을 제외하는 것에서부터 시작하는 일이다. 스크리닝은 그런 ‘제외의 기술’이다. 나는 정량적인 데이터를 기반으로 내 방식대로 시장을 걸러내고, 그 안에서 조금씩 기회를 좁혀 나간다.
이 작업은 생각보다 오래 걸린다. 하지만 엑셀을 켜고, 하나씩 수치를 정리하다 보면 어느새 시간이 훌쩍 지나가 있다. 귀찮은 일이지만, 집중해서 몰입해 있으면 오히려 마음이 편해지는 일이다. 그렇게 나는 수천 개의 숫자 사이에서, 내 기준에 맞는 회사를 하나하나 찾아간다. 이것은 많은 시간을 소요로 한다. 예전 글에서도 언급했지만 이 과정을 즐길 수 없다면, 결국 Index 펀드 투자로 시장의 수익성(Beta)을 목표로 투자하는 것이 현명하다고 생각한다.
2. Market Capitalization(시가총액) : 규모를 읽고 유동성을 가늠한다.
가장 먼저 확인하는 항목은 시가총액이다. 주식은 결국 유동성을 기반으로 거래되는 자산이기에, 일정 수준의 시가총액은 회전 가능성을 확보하는 전제 조건이다. 사모투자가 아닌 이상, 시장에서의 유동성 부족은 곧 가격 왜곡과 거래 리스크로 연결될 수 있다.
다만 나는 무조건 대형주를 선호하진 않는다. 오히려 5천억~1.5조 원 수준의 소형주를 선호하는 편이다. 이 정도 규모면 유동성은 확보되면서도, 여전히 시장이 덜 주목한 알짜 기업이 존재할 수 있기 때문이다. 반면 일본 시장에서 시가총액이 3천억 원 이하, 한국 시장에서 1천억 원 이하인 경우는 신중히 접근한다. 거래량 부족과 소수 주주에 의한 가격 변동성 등, 구조적인 리스크가 있기 때문이다.
그럼에도 불구하고 시가총액은 절대적인 투자 기준은 아니다. 때로는 비정상적으로 저평가된 중소형주가 훨씬 더 큰 기회를 제공하기도 한다. 그래서 나는 시가총액을 스크리닝의 첫 관문, 즉 “규모감과 유동성 점검 단계”로 활용하되, 이 숫자 하나에 절대적인 의미를 두진 않는다.
3. 산업과 섹터 : 이해 가능한 범위 안에서만 기회가 보인다.
기업을 스크리닝 하고 투자 대상으로 삼기 이전에, 나는 먼저 그 기업이 속한 산업과 섹터를 본다. 세상에는 수많은 산업이 존재하지만, 그중에서 내가 이해할 수 있는 산업은 제한적이다. 나는 이 사실을 있는 그대로 받아들이고, 나만의 시야 안에 들어오는 산업 안에서만 투자 기회를 찾는 편이다.
물론 처음 보는 산업에 호기심을 가지고 접근하는 경우도 있다. 하지만 그것은 어디까지나 공부와 탐색의 영역이지, 바로 투자로 이어지진 않는다. 증권사 보고서나 뉴스 흐름에 휩쓸려 낯선 산업에 단기적으로 올라타는 일은, 내가 알고도 투자해서 손해 보는 것보다 훨씬 나쁜 선택이라고 생각한다. 스스로 이해하지 못하는 산업에 돈을 넣는 것은 결국 ‘맹신’ 일뿐, 분석이나 판단이 아니다.
그래서 나는 초심자라면 먼저 2~3개의 산업을 선택해 깊이 공부하고, 그 산업을 중심으로 종목을 스크리닝 하는 것이 현명하다고 본다. 산업에 대한 구조적 이해 없이 종목을 고르는 건, 지도 없이 산을 오르는 것과 다름없다.
나의 경우는 제조업 기반의 산업군을 중심으로 보고 있다. 제조업 내에서도 몇몇 유사한 산업을 집중적으로 보다 보면, 자연스럽게 공통적인 구조, 사이클, 밸류체인이 눈에 들어온다. 예컨대, 반도체 장비주는 2차 전지 장비주와 유사한 구조를 가진다. 또, 2차 전지 산업을 이해하고 나면 그 안의 셀 제조사, 1차·2차 벤더, 소재업체까지 연결해서 큰 그림을 그릴 수 있다.
최근에 원자력 관련 투자들을 진행했을 때도, 반도체 장비주에 대한 과거 분석 경험이 많은 도움이 되었다. 기술적 이해뿐 아니라, 장비업체가 벨류체인에서 어떤 위치를 차지하는지, 투자 타이밍이 수주 주기와 어떻게 엮이는지에 대한 감각이 그대로 전이됐기 때문이다. 반대로, 금융업이나 다양한 산업을 보유한 지주회사들의 경우는 내가 투자하지 못한다. 과거에 대한 분석도 어렵거니와 미래 실적에 대한 대략적인 시나리오 구성도 나에게는 어렵다. 그렇기 때문에, 내가 분석하고 시나리오를 구성해 볼 수 있는 산업만을 대상으로 투자한다.
결국 내가 아는 산업 안에서, 구조를 입체적으로 이해하고, 연결 지점을 찾아내는 것이 나만의 스크리닝 전략의 기반이다. 시장에는 언제나 수많은 기회가 있지만, 내가 이해할 수 없는 기회는 애초에 기회가 아니다. 투자의 본질은 선택이 아니라, 제외에서부터 시작된다. 그렇기에 나는 언제나 스스로에게 물어야 한다. “이 산업은 내가 진짜로 이해하고 있는가?”
4. Revenue, EBIT, Net Income : 실적은 내재가치의 출발점이다.
기업의 숫자 중 가장 기본이 되는 것은 매출(Revenue), 영업이익(EBIT), 그리고 당기순이익(Net Income)이다. 이 세 가지 지표는 단순한 숫자가 아니라, 회사의 사업 모델, 경쟁력, 비용 구조, 그리고 시장 내 위치를 가장 잘 드러내는 기본 지표들이다. 나는 이들을 내재가치(Intrinsic Value) 분석의 기초로 활용하며, 가장 앞단에서 사업의 건강 상태를 가늠한다.
스크리닝 1단계에서는 당연히 이 숫자들을 세부적으로 분해할 수는 없다. 하지만 전체적인 규모, 성장률, 수익성 수준을 파악하는 데는 충분하다. 가장 먼저 매출을 본다. 매출은 기업이 실제로 시장에서 ‘팔고 있는 것’의 총량이며, 가장 직관적으로 기업의 체력을 보여준다. 이 매출이 단순한 사이클이 아니라 구조적 성장으로 이어지고 있는가, 그리고 업황의 업턴과 다운턴에서 얼마나 방어력이 있는가를 확인한다.
여기서 내가 중요하게 보는 포인트는 다음과 같다.
• 과거 5년~10년 기준 CAGR(연평균 성장률)이 성장하고 있는지?
• 외형(매출)이 어떤 주기의 사이클을 가지고 있는지
• 다운턴에서 실적이 급락하는지 아니면 방어적인지
• Top Line만이 아닌 EBIT, Net Income까지 밑단에서 수익이 연결되고 있는 구조인지
이런 점들을 빠르게 살펴보면, 그 기업이 단순히 “크기만 한” 회사인지, 아니면 구조적으로 돈을 잘 버는 회사인지 구별할 수 있다.
특히 나는 매출과 EBIT 사이의 간극을 유심히 본다. 매출은 증가하는데 EBIT이 오히려 정체되어 있다면, 이는 원가율 혹은 판관비 구조에 문제가 있거나, 수익이 나지 않는 매출 확장일 수 있다. 반대로 EBIT 대비 Net Income이 과도하게 낮은 기업은 지나친 금융비용이 많거나 영업 외 수익/비용 측면에서 검토가 필요하다.
결국 이 세 지표는 내재가치를 추정하기 위해 반드시 필요한 기반이다. 아무리 이후에 발생하는 멀티플인 PER, ROE, PBR 같은 비율 지표를 본다 해도, 분모와 분자에 들어가는 실적이 신뢰할 수 없으면 그 모든 계산은 무의미해진다. 그래서 나는 이 실적 수치들을 단순한 숫자가 아닌 사업에 대한 정성적 해석을 위한 출발점으로 받아들인다.
스크리닝 단계에서는 숫자의 추세만 빠르게 파악하고, 좀 더 자세한 분석은 이 첫 관문을 통과한 소수의 기업에 집중한다. 단기 사이클은 넘어가더라도, 구조적인 성장이 보이지 않는다면 Drop 하는 편이다.
5. 자산, 부채, 자본, 부채비율 : 재무구조는 기업의 내구성이다
기업의 재무구조를 읽기 위해 가장 기본적으로 살펴보는 항목은 총자산(Total Assets), 총부채(Total Debt), 자기자본(Total Equity)이다. 하지만 나는 이 세 항목의 절댓값 자체보다는, 이들이 형성하고 있는 부채비율(Debt to Equity Ratio)의 구조를 더 중점적으로 본다.
총자산은 기업이 보유한 “몸집”이자 외형의 크기다. 하지만 규모 자체가 크다고 해서 그것이 곧 투자 대상으로 적합하다는 뜻은 아니다. 자산이 크더라도 그 구성이 고정자산 위주인지, 운전자본 위주인지, 혹은 무형자산이 많은 구조인지에 봐야하고 더 중요한 것은 자산 자체보다는, 그 자산이 어떤 자본구조로 조달되어 있는지를 유심히 봐야한다.
여기서 핵심이 되는 것이 바로 부채비율이다. 나는 일반적으로 부채비율이 100{61dd6028939e6e9509497ea9515dd6fa0e1cd722d4bf42155a61f48a59c57374} 이상인 기업은 유의해서 스크리닝 한다. 지나치게 높은 레버리지는 시장 환경의 변화에 따라 급격한 이익 변동성으로 이어질 수 있기 때문이다. 내 기준에서 안정적인 부채비율은 30~50{61dd6028939e6e9509497ea9515dd6fa0e1cd722d4bf42155a61f48a59c57374} 내외이다. 이 범위는 일정 수준의 자본효율성을 확보하면서도, 외부 충격에 대한 회복력을 갖출 수 있는 구조라고 판단하는 편이다.
단, 부채비율을 볼 때 반드시 고려해야 할 점이 있다. 산업별로 영업부채 성격의 항목들이 부채로 잡혀 있는 경우, 단순 수치로는 과대계상될 수 있다는 점이다. 산업적 특성을 이해하고 조정된 시각으로 부채비율을 해석해야 한다.
6. PER, EBIT 멀티플 : 숫자에 담긴 시장의 평가, 그리고 착각
PER(주가수익비율)은 회사의 순이익에 대해 시장이 얼마나 높은 가치를 부여하고 있는지를 나타낸다. 수치는 단순하다. 시가총액을 최근 1년 순이익으로 나눈 값이다. 하지만 이 단순한 수치 속에는 시장 참여자들의 심리, 기대, 낙관과 조심스러움이 모두 녹아 있다.
가치투자의 관점에서 볼 때, 나는 PER를 절대적인 숫자로 해석하지 않는다. 내재가치라는 개념은 본질적으로 미래에 벌어들일 현금흐름을 적정한 할인율로 현재가치화한 것이다. 반면 PER는 오직 과거 실적에 대한 비율이므로, 미래가치의 대용품으로 보기에는 본질적인 한계가 있다.
여기서 중요하게 보는 건 PER와 EBIT 멀티플 간의 괴리율이다. 순이익은 손익계산서의 가장 마지막 줄에 위치하고, 그만큼 조정이 들어갈 여지도 많다. 영업 외 수익, 자산 매각이익, 일회성 손실 등 비경상적인 이벤트가 반영되면 실제 영업성과와 무관하게 PER가 왜곡될 수 있다. 반면 EBIT은 본업에서의 수익 창출력을 보여준다. 그래서 나는 EBIT 멀티플과 PER가 유사한 흐름을 보이는지를 반드시 교차 확인한다. 괴리가 크다면 이유를 파야 하고, 그 이유가 설명되지 않는다면 그 기업은 1차 스크리닝에서 제외시킨다.
그렇다면 PER 20배라는 것은 무슨 의미일까? 아주 단순화해서 PEG (PER / 성장률)를 1로 가정하면, PER 20배는 시장이 연 20{61dd6028939e6e9509497ea9515dd6fa0e1cd722d4bf42155a61f48a59c57374} 수준의 이익 성장을 기대하고 있다는 신호로 해석할 수 있다. 물론 실제 시장이 “20{61dd6028939e6e9509497ea9515dd6fa0e1cd722d4bf42155a61f48a59c57374} 성장할 거야”라고 수치화된 예측을 갖는 건 아니다. 중요한 건, 긍정적인 성장 기대가 현재 주가에 충분히 반영되어 있다는 점이다.
나는 “적정 PER는 없다”라고 본다. 다만, “시장에서 받아들이고 있는 산업의 평균 PER는 있다”라고 본다. 예를 들어 화장품 섹터의 평균 PER가 18배, 2차 전지 섹터가 40배라는 것은, 시장이 그 산업의 향후 수익성이나 확장성에 대해 어떻게 기대하고 있는지를 반영한 것이다.
하지만 여기에는 중요한 함정이 있다. “산업의 성장성은 곧 개별 기업의 성장성을 보장하지 않는다.” 과거 자동차나 항공 산업이 폭발적으로 성장하던 시기에도 수백 개의 기업이 생겼지만, 결국 살아남은 건 소수였다. 산업의 평균 멀티플만 보고 개별 기업이 저평가되었거나 고평가 되었다고 판단하는 건, 투자자로서 가장 위험한 착각 중 하나일 수 있다.
7. ROE(Return on Equity) : 복리의 출발점
ROE(Return on Equity, 자기자본이익률)는 기업의 내면을 들여다보는 중요한 지표다. 나는 ROE를 단순히 수익성 지표 중 하나로 보지 않는다. ROE는 자본이 얼마나 효율적으로 운용되고 있는지를 보여주는 지표이자, 기업이 자본을 통해 ‘복리 구조’를 얼마나 잘 구축하고 있는지를 나타내는 핵심 척도라고 본다.
예를 들어, 공장 하나를 짓는 데 1,000억 원을 투입해 연 100억 원의 순이익을 내는 회사와, 1조 원을 들여 같은 100억 원을 버는 회사는 전혀 다른 투자 효율을 가진다. 겉으로 드러난 이익은 같지만, ROE를 기준으로 보면 전자의 기업은 10{61dd6028939e6e9509497ea9515dd6fa0e1cd722d4bf42155a61f48a59c57374}, 후자는 1{61dd6028939e6e9509497ea9515dd6fa0e1cd722d4bf42155a61f48a59c57374}로, 투자 대비 회수 효율이 극명하게 갈린다.
특히 장기 투자자에게는 ROE가 더욱 중요하다. 기업이 순이익을 유보하고 재투자할 때, ROE가 높을수록 유보이익이 더 빠르게 복리로 불어난다. 단기적인 이익보다 이익의 재투자 구조와 복리 속도에 관심을 갖는다면, ROE는 반드시 눈여겨봐야 할 지표다.
나는 일반적으로 15{61dd6028939e6e9509497ea9515dd6fa0e1cd722d4bf42155a61f48a59c57374} 이상의 ROE를 안정적으로 유지하는 기업을 긍정적으로 평가한다. 특히 20~25{61dd6028939e6e9509497ea9515dd6fa0e1cd722d4bf42155a61f48a59c57374} 수준을 몇 년간 꾸준히 유지할 수 있는 기업이라면, 이는 단순한 고수익이 아니라 경쟁력 있는 비즈니스 모델과 효율적인 자본 구조를 동시에 갖춘 기업이라는 신호다.
단, ROE는 항상 “분모”가 작은 구조일수록 왜곡될 수 있다는 점도 유의해야 한다. 예컨대 자기자본이 과도하게 줄어든 상황에서 일시적 이익이 발생하면 ROE가 비정상적으로 치솟는 경우도 있다. 레버리지를 활용한 일시적 높은 ROE인지, 구조적 경쟁력에서 나온 효율적인 ROE인지를 구분하는 것이 중요하다.
결국 가치투자라는 것은, 기업이 앞으로 벌어들일 미래 현금흐름의 총합을 적절한 할인율로 현재가치화했을 때, 그 계산된 내재가치보다 시장에서의 현재 주가가 저렴한지를 판단하는 과정이다. 다시 말해, 싸게 사기 위한 기준은 오직 하나, 내가 계산한 본질적 가치보다 시장 가격이 낮은가이다.
이를 위해 나는 멀티플(PER, EBIT 등)을 활용해 대략적인 정량 기준을 먼저 설정하고, 이 기준에 따라 1차적으로 시장을 스크리닝 한다. 이 단계에서는 지나치게 고평가 된 기업을 우선적으로 제외하고, 상대적으로 저평가되어 있는 듯 보이는 기업들만 다음 단계로 가져간다.
그다음부터는 개별 검토의 영역이다. 단순 수치가 아닌, 사업 구조와 전략, 수익성의 지속 가능성, 산업 사이클에 따른 민감도 등을 기준으로 시나리오 기반의 정성적 분석에 들어간다.
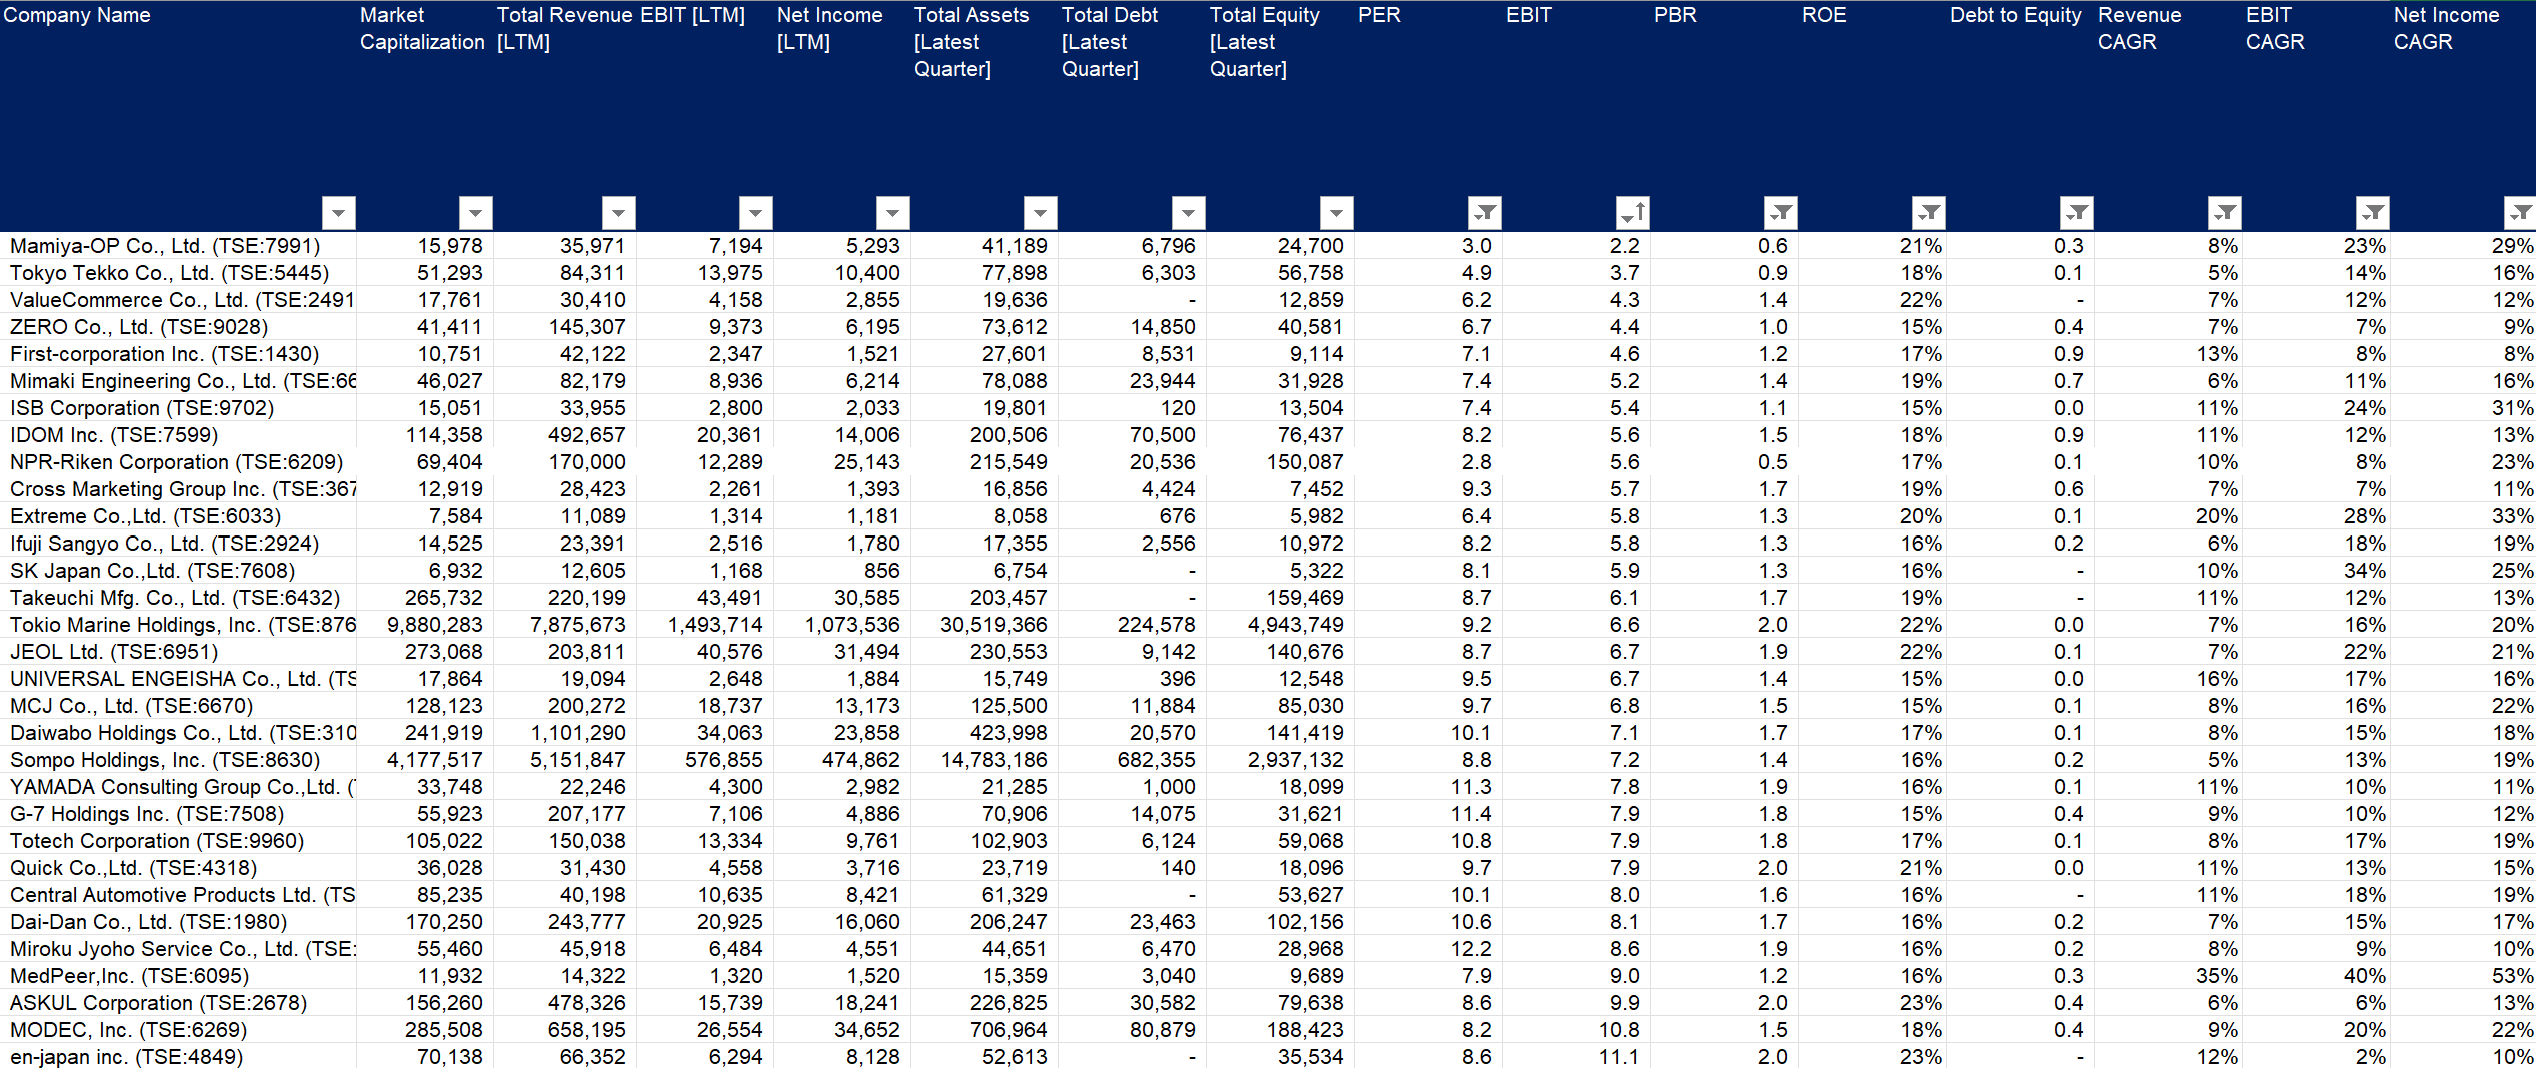
아래는 위와 같은 형태로 나열했던 나의 스크리닝 테이블이다.
(초기 스크리닝 자료로 아래 리스트의 기업에 투자한 것이 아닙니다.)
Talking with people who are passionate about stocks is always a pleasure. For me, investing in stocks isn’t simply a matter of money; it’s a channel through which I can study industries and look deeply into companies. So sharing perspectives with people who have studied similar sectors, and hearing their thinking, is always stimulating. A productive conversation with someone gives me the joy of learning, much like coming across a good book.
Friends sometimes ask me, “How do you invest in stocks?” I don’t answer that question with a neat formula or a list of tickers. Instead, I tend to talk about the reasoning behind my investment decisions, the context that led me to pick a particular name, and what my outlook on the industry is. I believe that sharing the thinking that leads up to a judgment is far more valuable than the outcome itself.
I don’t believe there is a “right answer” in investing. What matters more than returns is how I arrived at a given judgment. That isn’t simply a matter of listing information; it’s also a kind of training in how much I trust my own analysis, and whether I had the conviction to push that judgment through to the end.
In this piece, I want to lay out the screening criteria I’ve developed over the years of studying investing. I still consider myself to be exploring this world, so much so that I’d say the first thing I’d want to do if I became a student again is read every book about investing. And this piece is also a note I’m leaving for myself, midway through that journey.
1. How do I find companies?
I’m good at grunt work. Or more precisely, I don’t mind simple, repetitive tasks. This process, which to most people might look tedious and inefficient, is something I believe is the most valuable work in investing. Because I think market opportunities are ultimately found in that one extra step that most people can’t be bothered to take.
When I’m searching for companies, I take an approach that is, quite literally, close to grunt work. I mainly target companies listed in the U.S. and Japanese markets. The U.S., across its various exchanges, has close to 10,000 listed names, while Japan has just over 4,000. To find opportunities among these many companies, I repeat a near-exhaustive screening every quarter.
Once each quarter’s earnings season passes, I organize the most basic financial metrics by company in an Excel sheet: earnings, market capitalization, P/E, revenue, operating profit, net income, assets, liabilities, and so on. It isn’t merely lining up numbers; it’s the work of grasping what these numbers mean, comparing the differences between companies, and narrowing down the names with potential, one cell at a time.
I believe this process determines more than half of investing. It’s work that begins not with finding good companies, but with excluding the bad ones. Screening is that kind of ‘art of exclusion.’ Based on quantitative data, I filter the market my own way, and gradually narrow the opportunities within it.
This work takes longer than you’d think. But once I open Excel and start organizing the figures one by one, the time slips by before I know it. It’s a tedious task, but when I’m absorbed and focused, it actually puts my mind at ease. That’s how I find the companies that meet my criteria, one by one, among thousands of numbers. It demands a great deal of time. As I’ve mentioned in a previous piece, if you can’t enjoy this process, I think it’s wiser, in the end, to invest in index funds and target the market’s return (beta).
2. Market Capitalization: reading scale and gauging liquidity.
The first item I check is market capitalization. Since stocks are ultimately assets traded on the basis of liquidity, a certain level of market cap is a precondition for securing the ability to get in and out. Unless it’s a private investment, a lack of liquidity in the market can lead directly to price distortion and trading risk.
That said, I don’t unconditionally prefer large caps. If anything, I tend to favor small caps in the range of roughly 500 billion to 1.5 trillion won. At this scale, liquidity is secured, yet there can still be solid, overlooked companies that the market hasn’t paid much attention to. On the other hand, I approach with caution names with a market cap below 300 billion won in the Japanese market, or below 100 billion won in the Korean market. They carry structural risks such as insufficient trading volume and price volatility driven by a small number of shareholders.
Even so, market capitalization is not an absolute investment criterion. Sometimes an abnormally undervalued small- or mid-cap offers a far greater opportunity. So I use market cap as the first gate of screening—a “check on sense of scale and liquidity”—but I don’t assign any absolute meaning to this one number.
3. Industry and sector: opportunity is only visible within what I can understand.
Before I screen a company and treat it as an investment target, I first look at the industry and sector it belongs to. There are countless industries in the world, but the ones I can actually understand are limited. I accept this fact as it is, and I tend to look for investment opportunities only within the industries that fall within my own field of vision.
Of course, there are cases where I approach an unfamiliar industry out of curiosity. But that remains strictly in the realm of study and exploration; it doesn’t lead straight to an investment. Getting swept up by brokerage reports or news flow and jumping into an unfamiliar industry for the short term is, I think, a far worse choice than knowingly investing and losing money. Putting money into an industry you don’t understand is ultimately just ‘blind faith,’ not analysis or judgment.
That’s why I think it’s wise for a beginner to first choose two or three industries to study in depth, and screen names centered on those industries. Picking a stock without a structural understanding of the industry is no different from climbing a mountain without a map.
In my case, I focus mainly on manufacturing-based industry groups. Even within manufacturing, when you look intensively at a few similar industries, the common structures, cycles, and value chains naturally come into view. For example, semiconductor equipment stocks have a structure similar to that of battery equipment stocks. And once you understand the battery industry, you can connect the cell makers, the tier-1 and tier-2 vendors, and the materials companies within it to draw the bigger picture.
When I made some nuclear-power-related investments recently, my past experience analyzing semiconductor equipment stocks was a great help. Not only the technical understanding, but also the sense of where an equipment maker sits in the value chain and how investment timing ties to the order cycle carried over directly. Conversely, I can’t invest in financials, or in holding companies that own a range of different businesses. Analyzing their past is difficult, and even constructing a rough scenario for their future earnings is hard for me. For that reason, I invest only in industries where I can analyze and build a scenario.
In the end, understanding the structure in three dimensions within the industries I know, and finding the connection points, is the foundation of my own screening strategy. There are always countless opportunities in the market, but an opportunity I can’t understand isn’t an opportunity in the first place. The essence of investing begins not with selection, but with exclusion. That’s why I always have to ask myself, “Do I truly understand this industry?”
4. Revenue, EBIT, Net Income: earnings are the starting point of intrinsic value.
Among a company’s numbers, the most fundamental are revenue, operating profit (EBIT), and net income. These three metrics aren’t merely numbers; they are the basic indicators that best reveal a company’s business model, competitiveness, cost structure, and position within the market. I use them as the foundation of intrinsic value analysis, gauging the health of the business right at the front end.
At stage one of screening, I obviously can’t break these numbers down in detail. But they’re enough to grasp the overall scale, growth rate, and level of profitability. The first thing I look at is revenue. Revenue is the total amount of what a company is actually ‘selling’ in the market, and it shows a company’s strength most intuitively. I check whether this revenue is leading to structural growth rather than a mere cycle, and how much defensive resilience it has across the industry’s upturns and downturns.
The points I consider important here are as follows.
• Is the CAGR (compound annual growth rate) over the past 5 to 10 years growing?
• What kind of cycle does the top line (revenue) follow?
• Do earnings plunge in a downturn, or are they defensive?
• Beyond just the top line, is the structure one in which profit flows down through to EBIT and net income?
Looking at these points quickly lets me distinguish whether a company is simply “big” or whether it’s structurally good at making money.
In particular, I pay close attention to the gap between revenue and EBIT. If revenue is rising but EBIT is stagnant, that may indicate a problem in the cost ratio or the SG&A structure, or it may be revenue expansion that doesn’t generate profit. Conversely, a company whose net income is excessively low relative to EBIT may carry excessive financial expenses, or needs to be examined on the non-operating income/expense side.
In the end, these three metrics are an indispensable foundation for estimating intrinsic value. No matter how many ratio metrics like P/E, ROE, or P/B—multiples that come afterward—you look at, if the earnings that go into the numerator and denominator can’t be trusted, all those calculations become meaningless. So I take these earnings figures not as mere numbers, but as the starting point for a qualitative interpretation of the business.
At the screening stage, I quickly grasp only the trend of the numbers, and concentrate more detailed analysis on the small number of companies that pass this first gate. Even if I let a short-term cycle slide, I tend to drop a name if I don’t see structural growth.
5. Assets, liabilities, equity, debt ratio: financial structure is a company’s durability
The most fundamental items I examine to read a company’s financial structure are total assets, total debt, and total equity. But rather than the absolute values of these three items themselves, I focus more on the structure of the debt-to-equity ratio they form.
Total assets are the “size” a company holds, the scale of its outward form. But being large in scale itself doesn’t mean a company is suitable as an investment target. Even if the assets are large, you have to look at whether their composition is weighted toward fixed assets, working capital, or intangible assets—and more importantly, rather than the assets themselves, you have to pay close attention to the capital structure through which those assets are financed.
The key here is precisely the debt ratio. As a rule, I screen companies with a debt ratio of 100% or more with caution. Excessive leverage can lead to sharp earnings volatility as the market environment changes. By my standards, a stable debt ratio is somewhere around 30 to 50%. I tend to judge this range as a structure that secures a certain level of capital efficiency while also having resilience to external shocks.
One caveat, though, when looking at the debt ratio: depending on the industry, when items that are operating-liability in nature are booked as debt, the simple figure can be overstated. You have to understand the industry’s characteristics and interpret the debt ratio with an adjusted lens.
6. P/E and EBIT multiples: the market’s valuation embedded in the numbers, and the illusion
The P/E (price-to-earnings) ratio shows how high a value the market places on a company’s net income. The figure is simple: market capitalization divided by the most recent year’s net income. But within this simple number, the psychology, expectations, optimism, and caution of market participants are all dissolved together.
From a value investing perspective, I don’t interpret P/E as an absolute number. The concept of intrinsic value is, in essence, the present value of future cash flows discounted at an appropriate rate. P/E, on the other hand, is only a ratio against past earnings, so it has an inherent limitation as a proxy for future value.
What I consider important here is the divergence between the P/E and the EBIT multiple. Net income sits at the very last line of the income statement, and there is correspondingly a lot of room for adjustment. When non-recurring events such as non-operating income, gains on asset sales, or one-off losses are reflected, the P/E can be distorted regardless of actual operating performance. EBIT, by contrast, shows the earning power of the core business. So I always cross-check whether the EBIT multiple and the P/E move in a similar fashion. If the divergence is large, I have to dig into the reason, and if the reason can’t be explained, I exclude that company at the first round of screening.
So what does a P/E of 20x mean? In a very simplified way, if you assume a PEG (P/E / growth rate) of 1, a P/E of 20x can be read as a signal that the market expects roughly 20% annual earnings growth. Of course, the market doesn’t actually hold a quantified forecast saying “it’ll grow 20%.” What matters is that positive growth expectations are sufficiently reflected in the current share price.
I take the view that “there is no fair P/E.” But I do think “there is an average P/E for an industry that the market accepts.” For example, the fact that the cosmetics sector has an average P/E of 18x and the battery sector 40x reflects how the market expects each industry’s future profitability or expandability to play out.
But there’s an important trap here. “An industry’s growth doesn’t guarantee an individual company’s growth.” Even in the eras when the auto or airline industries were growing explosively, hundreds of companies sprang up, but in the end only a few survived. Judging an individual company to be undervalued or overvalued based solely on the industry’s average multiple can be one of the most dangerous illusions for an investor.
7. ROE (Return on Equity): the starting point of compounding
ROE (return on equity) is an important indicator for looking into the inner workings of a company. I don’t view ROE simply as one profitability metric among many. I see ROE as an indicator of how efficiently capital is being deployed, and as a core measure of how well a company is building a ‘compounding structure’ through its capital.
For example, a company that invests 100 billion won to build a factory and earns 10 billion won in annual net income, versus a company that spends 1 trillion won to earn the same 10 billion won, have completely different investment efficiency. The profit on the surface is the same, but on an ROE basis, the former is 10% and the latter 1%—a stark split in return-on-investment efficiency.
ROE matters even more for long-term investors in particular. When a company retains net income and reinvests it, the higher the ROE, the faster the retained earnings snowball through compounding. If you care more about the reinvestment structure of profits and the speed of compounding than about short-term earnings, ROE is an indicator you absolutely must watch.
As a rule, I view favorably companies that steadily maintain an ROE of 15% or more. A company that can consistently sustain a level of 20 to 25% over several years is, in particular, a signal of a company that has both a competitive business model and an efficient capital structure—not merely high profitability.
That said, you also have to be mindful that ROE can be distorted the smaller the “denominator” is. For instance, when equity has shrunk excessively and a temporary profit arises, ROE can spike abnormally. It’s important to distinguish whether it’s a temporarily high ROE driven by leverage, or an efficient ROE that comes from structural competitiveness.
In the end, value investing is the process of judging whether the current market price is cheaper than the calculated intrinsic value, when the sum of the future cash flows a company will earn is discounted to present value at an appropriate rate. In other words, the criterion for buying cheap is only one thing: whether the market price is lower than the intrinsic value I’ve calculated.
To this end, I first set rough quantitative criteria using multiples (P/E, EBIT, etc.), and screen the market in a first pass according to these criteria. At this stage, I prioritize excluding excessively overvalued companies and carry forward to the next step only the companies that appear relatively undervalued.
From there on, it’s the realm of individual review. Rather than simple numbers, I move into scenario-based qualitative analysis grounded in the business structure and strategy, the sustainability of profitability, and the sensitivity to the industry cycle.
Below is my screening table, laid out in the form described above.
(The companies in the list below are early screening material; this is not a record of companies I invested in.)

댓글을 남기려면 이메일로 가입/로그인해주세요. Sign in with your email to leave a comment.